Computer Tomography for Development and Process Optimization
Three-dimensional digital models of components created with the help of a computer tomograph enable targeted process optimization of injection molding and high-pressure die-casting processes.
Computer tomography is an X-ray-based procedure in which the test object is scanned from different angles. The test object is positioned on a turntable between an X-ray source and a detector.
The radiation from the X-ray source is partially absorbed by the test object and thus attenuated. The degree of attenuation depends on the irradiated material and the path length. The attenuated radiation is registered by the X-ray detector, which provides the radiograph of the test object from one angle. The test object is then rotated slightly and another radiograph is taken. This continues until the test object has completed one rotation and the multiple radiographs may be set to reflect the desired accuracy.
The Three-Dimensional Digital Model
After the CT scan, a digital model of the test object is calculated from the individual radiographs. In the digital model, the dependency on the path length is eliminated and the different materials of the test object are represented by different gray tones.
The accuracy of the model is a result of the number of pixels in the detector and also the degree of magnification. Since the component is placed between the X-ray source and the detector, its magnification increases with its closeness to the X-ray source. This magnification determines the size of a pixel in the digital model. Interpolation between the pixels allows the accuracy of the model to be increased still further. With 3D models, the term voxel is used instead of pixel.
Determination of the Surface Contour
The 3D model contains a gray tone for each voxel, which depends on its material. For a test object consisting of only one material, there is just one gray value in the image of the test object and another gray value where there is air. This transition between air and test object allows the surface of the test object to be determined.
Analysis of Components
The analysis of components takes place on the digital model of the test object. Here, different materials can be displayed or hidden, and digital sectioning can be performed in any plane. The model can be displayed either in 3D or in a 2D section.

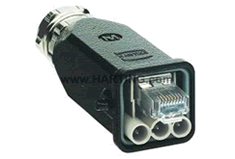
Figure 1. HARTING’s Han 3A Hybrid is an industrial -grade RJ45 Ethernet data connector with power con-tacts for hybrid applications.
As part of the final review before release, the contact overlap is checked to ensure the reliability of the connection. This is usually performed by sectioning the image. A section must be made to check the overlap of the power contacts (figure 2a). In addition, the deflection of the RJ45 connector in the various levels of the RJ45 connector’s spring must be checked (figure 2b).

Figures 2a and 2b: Section through the Han 3A Hybrid
Computer tomography allows a considerable simplification of this procedure. The connector is connected and scanned, and a digital model is produced. Subsequently, sections of the model can seen from any angle. Figure 4a shows a section through the 3D model, and figure 4b shows the 2D view of a plugged connector in one sectional plane.

Figures 3a and 3b: Sections through the digital model of the Han 3A Hybrid
Pore Analysis
Cavities and material defects exhibit different X-ray absorption characteristics than the solid material. This allows cavities and defects to be found through CT analysis of components. These can then be displayed in the digital model and color-coded to reflect their size. A cavity analysis can be performed for both plastic and metal components.
HARTING has used this to optimize process parameters with regard to the size, number, and distribution of cavities.
Determining the Dimensions of Components
The surface contour may be extracted from the digital model of the test object. This can be used to determine the dimensions of the component. Sections can be placed through the contour, so that dimensioning of a section is possible, analogous to conventional dimensioning.
Geometrical elements can be defined in the sectional view, so that dimensions that correspond to the drawing can be determined. The definition of the dimensions results from manually writing a measurement program.
However, there are several advantages over conventional dimensioning. In conventional dimensioning, as sections are made through manual labor, there is the danger of distortion caused by grinding the test object. With CT dimensioning, any number of digital sections can be produced without additional effort. This allows, for example, the examination at different heights of the vertical view of the chamber’s shape. It is only necessary to define the measurement program in a plane. Subsequently, the location of the sectional plane can be shifted in a loop. In addition, the measurement program need only be created once, then reused simply by replacing the contour. This is especially useful for the dimensioning of components with several cavities, but it also allows quick dimensioning for production monitoring or equipment replacement in tools.
Calibration Accuracy
The calibration accuracy of the computer tomograph is determined with a pin array and a cube containing spherical caps.
To ensure the measuring accuracy and the comparability of the optical measurement with the CT dimensioning, in addition to the calibration of the CT with the standard calibration jigs, HARTING has conducted investigations on components, such as optically measuring a chamber in a male connector as well as utilizing CT.
The optical dimensioning was performed with a plane view and was carried out several times by several users in order to minimize the influence of the user. For the CT dimensioning, the component was scanned several times. The CT dimensioning was then done as a defined sectional plane.
When comparing the results, the different measurement strategies must be taken into account. With the optical measurement in plane view, a minimal dimension of the chamber width is read, since it is always the corresponding outermost contour which appears as the edge. With the CT, the measurement is determined exactly in a sectional plane. This can be freely defined, which similarly allows the minimal dimension of the chamber width to be determined. Then the optical and the CT measurement results are in agreement.
Optimized Measurement Procedure
Since measurement programs, once written, can easily be reused, the possibility of an optimized measurement procedure arises. When the CAD model of a new component is produced, this is used to produce the corresponding tool. But this model can also serve in parallel as the basis for producing the measurement program, using the surface contour defined in the model. When the first samples fall out of the tool, these will be scanned and the artificial surface contour, based on the CAD model, will be replaced with the actual surface contour of the sample. Using the previously produced measurement program, the dimensions can then be obtained automatically.
False Color Comparison
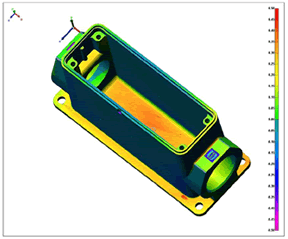
In addition to the determination of individual measurements, the deviations between two contours can also be represented with false color comparison. Here, the deviations between the contours are indicated with colors.
On the one hand, this allows a comparison between a real contour and a CAD contour. This enables a good overall impression of a component that goes beyond the comparison of dimensions, to include easy recognition of the distortion of a component or the sinking of individual contours.
In addition, two real contours can also be compared with one another. In this way, the condition of a tool can be monitored or individual cavities can be compared with one another. Figure 5 shows the false color comparison of a housing.

Figure 4: False color comparison of a Han housing
In summary, three-dimensional digital models of components created with the help of a computer tomograph enable targeted process optimization of injection molding and high pressure die-casting processes.
[hr]
Dr. Stephan Middelkamp works for HARTING KGaA.


