Facts & Figures: 10 Years of Connector Industry Balance Sheets
Bishop & Associates examined 10 years of connector industry balance sheets, which revealed consistent performance that rewarded investors.
The connector industry grew to almost $53 billion in 2014. It is an industry with a good balance sheet and not a lot of long-term debt. Let’s take a look at some of the stats that support this.
The following chart provides the industry current ratio, which is calculated by dividing current assets by current liabilities for 2004 through 2013.
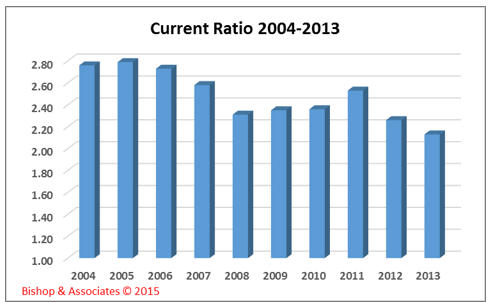
The average current ratio was 2.49 for the 10-year period. In 2013, the average current ratio was 2.13. This ratio indicates that the industry’s ability to meet short-term debt obligations is good. A ratio at or below 1.0 is not good.
The following chart provides the industry return on assets (ROA) as a percent of income to total assets. This number equals the net income divided by the total assets of a company and indicates how well the company is using its assets to produce income. The time period covered is 2004 through 2013.
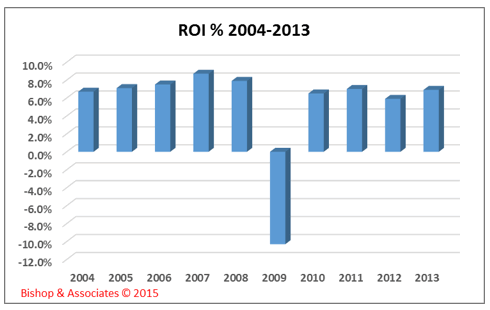
Return on assets has averaged 5.3% over the last 10 years (and 6.9% in 2013) indicating a generally good and consistent use of assets to generate income.
The following chart provides the industry return on equity (ROE). ROE is the net income divided by the shareholder’s equity and is a measure of how much profit the company can generate with the shareholder’s investment. The time period covered is 2004 through 2013.
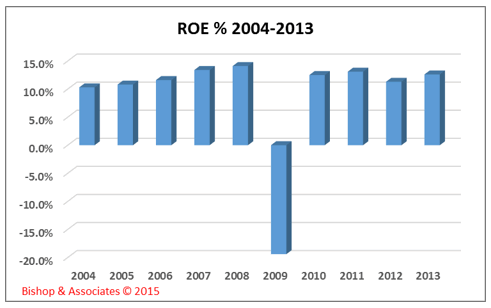
ROE has generally been in the low double digits for the industry. Activity in 2009 brought the 10-year average down to 8.9%, but 2013 was 12.6%. Other than 2009, ROE has been relatively consistent, which investors like to see.
The following chart provides the industry long-term debt-to-equity ratio. This is comprised of the total liabilities of the company divided by the shareholders’ equity. A high ratio indicates that the company has been aggressive in financing its business with debt. The time period covered is 2004 through 2013.
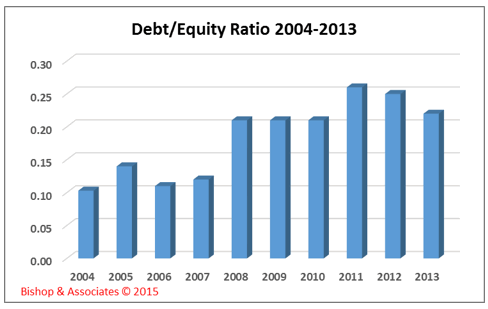
The long-term debt-to-equity ratio has generally been low for this industry (it does not carry a lot of debt on its books). The 10-year average for the ratio is 0.18 and 0.22 in 2013. It is notable that this ratio has generally been on the rise over the last 10 years.
In the final analysis, connector companies are very-profitable, highly sought-after acquisition targets and frequently sell for high EBITDA multiples.
No part of this article may be used without the permission of Bishop & Associates Inc. If you would like to receive additional news about the connector industry, register here. You may also contact us at [email protected] or by calling 630.443.2702.
- The Outlook for the Cable Assembly Industry in 2021 and Beyond - May 18, 2021
- A Data-Hungry World is Driving Demand for Wireless Connections - January 26, 2021
- Innovation and Expansion Drives Growth of Global Cable Assembly Market - May 7, 2019
