Corrosion and Contact Resistance
Dr. Bob follows up his recent article on connector contact lubricants with a look at connector corrosion and contact resistance.
While I was making the final edits to my recent Connector Supplier article on connector contact lubricants, I looked at the figure in that article, which showed the structure of the contact interface on a microscale, a different version of which is shown as Figure 1.
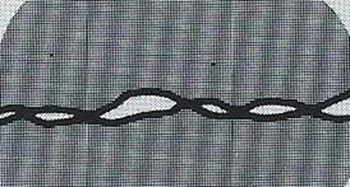
Figure 1: Cross section of a contact interface
The key point of the figure, which is a cross section of the contact area, is that the contact area consists of several individual contact spots where high points of the rough surfaces on a microscale, called asperities, come into contact and form a-spots, which are the effective electrical contact surfaces. I described the valleys surrounding the a-spots as channels where the contact lubricant could flow away from the a-spots when it was displaced as the plug contact came to rest on the receptacle contact. You may recall that as the plug contact engaged the receptacle, the contact lubricant provided a surface of reduced friction, which resulted in both reduced mating force and reduced contact wear. Because contact lubricants are not conductive, however, the lubricant must be displaced, as described above, to allow the desired metal-to-metal electrical contact interface to be created.
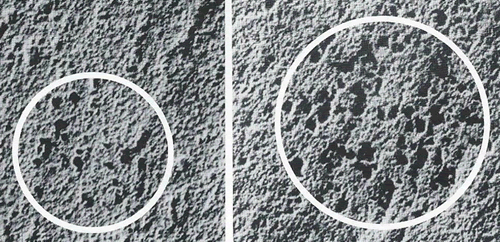
Figure 2: Two contact interfaces
Figure 2 shows a view of two contact interfaces, effectively a downward-looking view on the contact area of Figure 1. The a-spots, the desired metal-to-metal contact areas, are the flat surfaces created as the asperities on each surface deform against one another. The microscale roughness of the surface shown is clear as are the areas surrounding the contact spots, which are the “channels” described relative to Figure 1 into which the contact lubricant can flow as it is displaced from the a-spot areas. This flow of lubricant effectively blocks those channels, and we finally come to our subject: Corrosion and the contact interface.
If not blocked by the contact lubricant, those channels would provide pathways for any corrosive elements in the connector ambient to reach the a-spots and attack the desired metal-to-metal a-spot interfaces. To understand the corrosion dynamics, we must consider Figure 3.
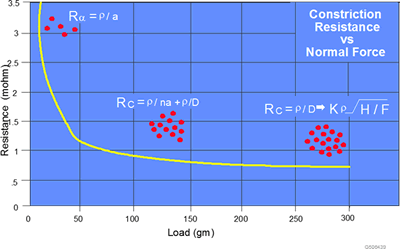
Figure 3: Constriction Resistance Versus Contact Force
For the purposes of this discussion, constriction resistance is the same as contact interface resistance. Note that contact resistance decreases with the contact force. It does so for two reasons: As the contact force increases, the two surfaces are brought closer together, which means more a-spot interfaces are created and the total contact area, a-spots plus valleys, increases.
This brings us to the equation in the center of Figure 3:
RC = ρ/nad + ρ/D
where RC is the contact resistance; ρ is the resistivity of the materials in contact; ρ/nad represents the resistance of the parallel combination of n a-spot contacts, each of which have a resistance given by ρ/ad, where ad is the diameter of the a-spot, and ρ/D represents the resistance of the distribution of the a-spots over the contact area of diameter D. These two resistance contributions are in series because the current flow is constricted, first to the contact area distribution and then to the individual a-spot contacts. (Just trust me; this is not the main point of the discussion.)
In Figure 2, the contact area distribution is indicated by the white circles. The contact areas shown were created under two different conditions of contact plug radius and contact force to generate the same effective stress at the contact interface. Obviously, the smaller white circle system used a smaller plug radius and a lower contact force than the larger white radius system. The smaller radius is evident in the smaller circle and the lower force is evidenced by the smaller a-spot diameters within the circle. The larger circle contact will have more, and larger, a-spot contacts. Both contacts will display the same corrosion dynamics.
The corrosive ambient environment of the connector will be attenuated in several ways. First, the connector housing itself will restrict the access of the corrosive ambient to the contacts. Second, the geometry of the surfaces of the plug and receptacle will provide a second level of attenuation. Once the corrosive ambient gets to the contact area, the a-spots near the periphery of the contact area will be directly susceptible to the attenuated environment. The a-spots within the contact area will see further attenuation of the environment due to the small spacing between the surfaces which are not actually in contact (that is, the valleys cited earlier). This multi-level attenuation of the environment is a major reason why connectors can survive in harsh environments. The filling of the valleys by the displaced lubricant provides a further level of attenuation, which is evident in the superior performance of lubricated connectors in harsh environments.
Corrosion will take place earlier and more aggressively at the peripheral a-spots. Interior a-spots will see an attenuated environment. Eventually the corrosive environment will get to all the a-spot contacts and they will degrade. The corrosion will reduce the diameter of the a-spots, which, as noted above, will increase the a-spot contact resistance. The contact distributional area will effectively decrease as the resistance of the peripheral a-spots rises. Thus corrosion increases both terms in the Figure 3 equation cited above. The high level of redundancy of the a-spot distribution leads to an exponential increase in contact resistance. Resistance increases slowly as the peripheral a-spot resistance rises more rapidly when the distribution area begins to diminish, and is further accelerated as the a-spot resistance continues to rise and a-spots are lost, reducing the contact redundancy. This corrosion dynamic has been modeled with the finding that these conditions will lead to significant increases in contact resistance only after decades of exposure, suggesting that a different dynamic is active in practice.
At this point, those of you that have been following my articles will not be surprised to have me segue into why contact normal force is arguably the most important connector design parameter. There are two reasons. First, the contact normal force creates the initial contact area, which determines the initial contact resistance. Second, the contact normal force determines the friction force at the contact interface and, thus, the mechanical stability of the contact interface. In light of the previous discussion, this is obviously an important consideration. If the friction force is high enough to prevent movement of the contact interface under the thermal and mechanical driving forces active in the field, the corrosion dynamic just discussed is appropriate and the contact resistance will remain “stable.” In other words, we can expect mechanically stable contact interfaces will be electrically stable. I suggest that the field performance of “blade” or “quick connect” connectors in industrial, white goods, and automotive applications over the years supports this assertion. Unfortunately, the contact force required to ensure mechanical stability in a given application is generally unknown. In addition, the negative effects of contact normal force, increased mating force, and increased contact interface wear must be considered.
- Nanocrystalline Silver Alloy Contact Finishes in Electronic Applications - April 6, 2015
- Nanocrystalline Silver Contact Platings - March 16, 2015
- Dr. Bob on Gold Flash Contact Finishes (and Max Peel) - September 22, 2014