2013 Connector Industry Final Results
Connector Supplier compares 2013 industry results with Bishop & Associates’ predictions.
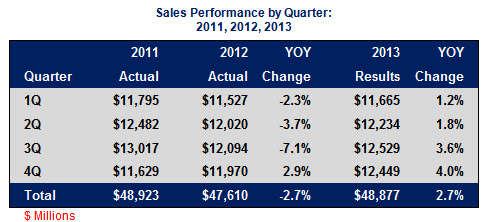
Worldwide industry sales in 2013 were up +2.7% for the full year over 2012. Sales totaled $48,877 million. Fourth quarter sales were $12,449 million, up +4.0% over the prior year. Note that 2013 results offset the sales decline in 2012 and got us back to the to sales achieved in 2011.
Industry sales by region for full year 2013 can be seen in the following table.
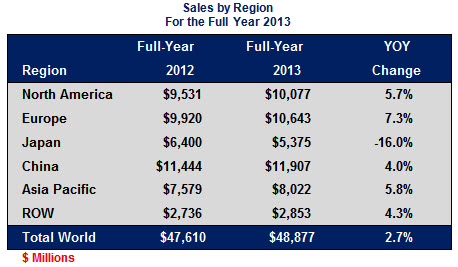
Japan was the only region to decline in 2013. Its sales contracted -16.0% year over year.
The following table shows the industry’s actual sales results versus the Bishop Forecast. The forecast was very accurate on total world sales but off slightly by region. North America, Europe, and China had better sales in 2013 than forecast. Japan had a very poor year, worse than we expected.

Key observations:
- Japan’s connector industry finished -7.6% below forecast. Japan’s performance was primarily the result of a stagnant economy due to a high yen value in 2012 and in the beginning of 2013, which suppressed exports.
- North America’s industry performance was +1.0% better than forecast. This was the result of a strong automotive market in North America.
- Europe’s connector industry outperformed the forecast by +2.2% over 2012. This was the result of general improvements in the European economies and easy comparisons due to the poor performance of the connector industry in 2012.
- China started off 2013 on a relatively soft note, but then business picked up in the last half of the year. China finished the year just slightly better than forecast, as did Asia Pacific.
- ROW was slightly below forecast.
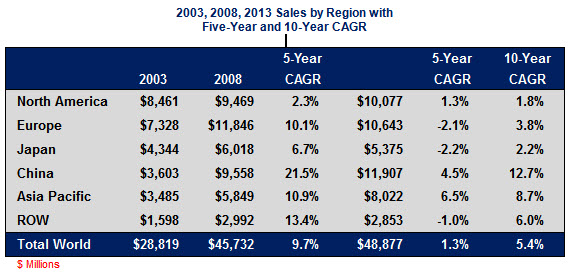
The following table displays industry sales performance by region over the past 10 years. All in all, this past decade could be categorized as “just OK.” The 10-year CAGR was 5.4%, with most of the growth happening in the 2003 to 2008 period. The past five years could be categorized as “lethargic,” achieving a poor 1.3% CAGR.
Here’s why we believe the next five years will be better:
- Europe seems to be in a modest recovery.
- The US economy is recovering.
- Inflation is very low.
- Interest rates are historically low.
- China is showing signs of improved growth.
- The Federal Reserve continues a growth policy.
- Connector demand is showing mid-single-digit growth.
Dave Pheteplace, VP, Bishop & Associates, Inc.

- The Outlook for the Cable Assembly Industry in 2021 and Beyond - May 18, 2021
- A Data-Hungry World is Driving Demand for Wireless Connections - January 26, 2021
- Innovation and Expansion Drives Growth of Global Cable Assembly Market - May 7, 2019