Facts & Figures: The Connector Confidence Index
How does the connector industry view itself? According to the Connector Confidence Index, not always well.
Bishop & Associates polls connector industry executives monthly to see how they view the industry’s performance, both current and future. The executives are asked to rate the performance by four regions that are key to the industry: North America, Europe, Japan, and Asia. The questions asked are, “What is your appraisal of current business conditions?” and “What is your expectation of future business conditions six months from now?” Participants can respond either positive, negative, or neutral. The results are a good indication of how the industry is doing today and where it is headed.
The following graph displays the World Connector Confidence Index (WCCI), which is an average of all responses in regard to the present situation and the future expectations.
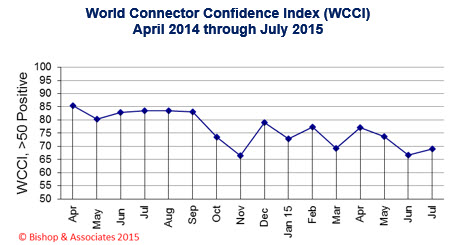
As can be seen in the above graph, the WCCI has been generally trending down in 2015, particularly as compared to 2014 when the industry was growing in the high single-digits. The downward trend is attributed to the slowing of economic growth in China, the weak economic recovery of North America, and the devaluation of the euro, yen, and yuan.
The following graph shows the CCI for the present situation for the last 19 months.
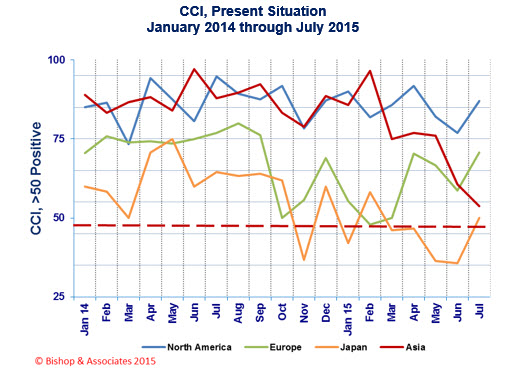
As seen in the graph, North America has been positive over the last 19 months with the CCI fluctuating from 76 to 94. Year to date through July, North American industry sales are only down slightly at -1.0%, which accounts for the better assessment by North American connector executives.
Asia’s CCI, which includes China, has run very high until recently. It dipped to 54 in July, which reflects the slowing down of the Chinese economy and some of the other issues in the region.
Europe’s CCI generally has been improving after reaching or going below 50 (below 50 is a negative response) three times since last October.
Japan’s CCI has not performed well during this timeframe as its economy has struggled.
The following graph shows the CCI for the future of the connector industry.
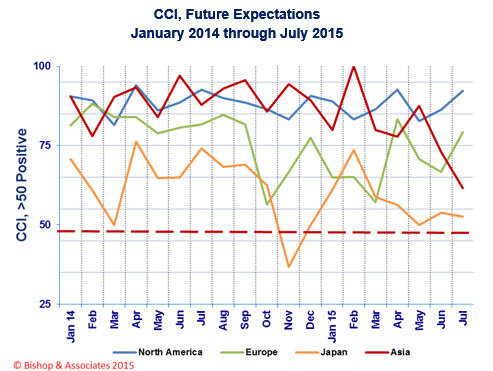
North America’s future CCI has ranged from 83 to 92 over the last 19 months, which is pretty optimistic. Asia and Japan’s future CCI has been trending down recently, while Europe’s future view has been trending up.
The connector industry growth is projected by Bishop to be slightly down (low single-digits) for 2015.
No part of this article may be used without the permission of Bishop & Associates Inc. If you would like to receive additional news about the connector industry, register here. You may also contact us at [email protected] or by calling 630.443.2702.

- The Outlook for the Cable Assembly Industry in 2021 and Beyond - May 18, 2021
- A Data-Hungry World is Driving Demand for Wireless Connections - January 26, 2021
- Innovation and Expansion Drives Growth of Global Cable Assembly Market - May 7, 2019