Facts & Figures: The 2013 Top 10 Gain Market Share
Bishop & Associates looked at the 2013 top 10 connector companies and the history of the companies that have held those spots, only to discover a pattern in which the top 10 gain market share.
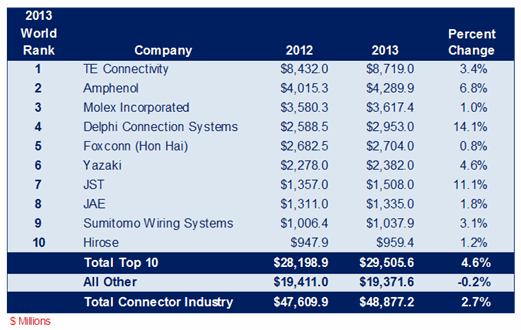
Collectively, the top 10 largest connector manufacturers increased their sales by +4.6% in 2013 versus world industry growth of +2.7%. Total sales of the top 10 suppliers accounted for 60.4% of world connector demand.
The following table identifies the top 10 ranked by total world sales.
Top 10 Connector Suppliers 2012-2013
Since 1980, when Bishop & Associates began tracking the connector industry, the top 10 have steadily gained more share of the market. However, top 10 market share gains have not been a straight line upward. There are periods when the rest of the connector industry performs better than the 10 largest companies.
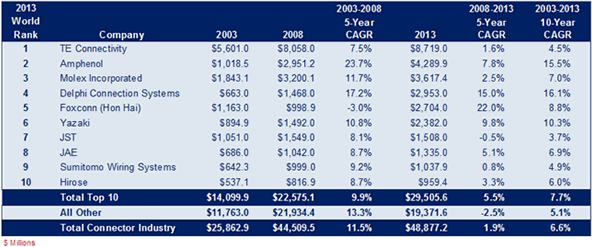
For example, between 2003 and 2008, companies without a top 10 ranking achieved growth of +13.3%, while the top 10 grew only +9.9%. This generally happens when there is a pause in acquisitions by top 10 companies.
The following table clearly demonstrates that companies outside the top 10 can perform better during certain periods. It shows top 10 performances in five-year increments, 2003-2008 and 2008-2013. Note how “all others” achieved better growth than the top 10 companies in the 2003-2008 timeframe.
2003, 2008, and 2013 Top 10 with Five- and 10-Year CAGR
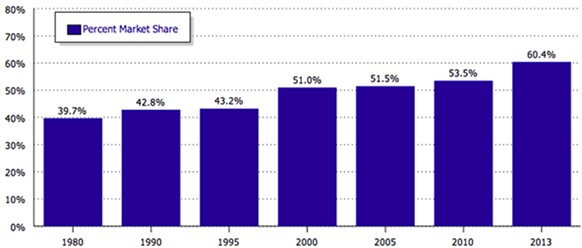
The following chart clearly shows the steady market share gains the top 10 have achieved, making the connector industry increasingly top-heavy. Top 10 companies now account for 60.4% of world connector demand.
Top 10 Share of World Market
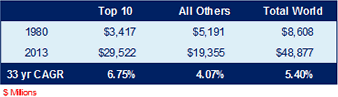
Since 1980 (33 years), the top 10 have achieved a CAGR of +6.75% compared to “all others” with a CAGR of 4.07%. That is a huge difference over a 33-year timeline.
33-Year Sales Growth History, 1980 – 2013
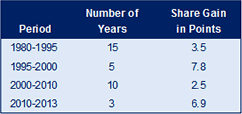
Market share of the top 10 has increased steadily, but not in a consistent manner, often occurring in clusters. For example, between 1980 and 1995 (15 years), the top 10 gained only 3.5 points in market share, as compared to 6.9 points in market share between the years 2010 and 2013 (three years).
Top 10 Market Share Gains
Logically, the largest companies should gain a larger and larger share of the market over time because large companies have:
- Broader product offerings
- Global manufacturing footprints
- Larger sales and marketing organizations
- Larger engineering organizations
- Larger customer bases
Such resources automatically place these companies on the vendor approval list of most OEMs, which translates into market share gains. However, market share gains attributed to the additional and broadened capabilities of the largest connector companies account for only small, incremental market share gains. The big, meaningful market share gains of the top 10 companies have come from acquisitions.
As evidence, between the years 2010 and 2013, the top 10 gained 6.9 market share points in three years because of the following acquisitions:
TE Connectivity acquired:
- Deutsch (2012)
- ADC (2011)
Molex acquired:
- FCT (2013)
- Affinity Medical (2012)
- Luxtera’s Merge Optics (2011)
Amphenol acquired:
- Tecvox LLC (2013)
- Hangzhou Jet Interconnect (2013)
- Ionix Aerospace Ltd (2013)
- GE Advanced Sensor (not connectors) (2013)
- Holland Electronics (2012)
- Griffin Enterprise (2012)
- Tel-Ad Electronics (2012)
- Nelson Dunn (2012)
- Deutgen Group (2012)
- FEP (2012)
- Cemm Thomas (2012)
Delphi acquired:
- FCI Automotive (2012)
These acquisitions added approximately $2.5 to $3.0 billion in sales to the top 10 companies or between five and six market share points. Hence, acquisitions accounted for most of the 6.9 market share points gained by the top 10 between 2010 and 2013.
Market share gains can be achieved through internal growth, but significant market share growth comes only from acquisitions, as the top 10 performance clearly demonstrates.
Ron Bishop, President, Bishop & Associates, Inc.
[hr]
No part of this article may be used without the permission of Bishop & Associates Inc. If you would like to receive additional news about the connector industry, register here. You may also contact us at [email protected] or by calling 630.443.2702.

- Is the Gold Rush Over for China Connector Sales? - October 17, 2023
- The Top Five European Connector Suppliers for Product Quality and Price Competitiveness - October 10, 2023
- 2023 Top Five European Connector Suppliers - September 26, 2023